Grafana: Go Processes
What metrics are included in the Go Processes dashboard?
Open Match is instrumented with OpenCensus, a telemetry library. The metrics that Open Match provides give you insight into the performance and health of your Open Match cluster. Currently, Open Match supports the following telemetry backends:
At this point we provides two ways to install supported telemetry backend, either via K8S yaml files or via helm.s
Install via K8S yaml
# Install Prometheus
kubectl apply -n open-match -f https://open-match.dev/install/v1.8.0/yaml/03-prometheus-chart.yaml
# Install Grafana
kubectl apply -n open-match -f https://open-match.dev/install/v1.8.0/yaml/04-grafana-chart.yaml
# Install Jaeger
kubectl apply -n open-match -f https://open-match.dev/install/v1.8.0/yaml/05-jaeger-chart.yaml
# Install the above telemetry backends with Open Match core services
kubectl apply -n open-match -f https://open-match.dev/install/v1.8.0/yaml/install.yaml
# Install Stackdriver
# No need to install, provided by GKE by default.
Install via helm
$ helm install my-release --namespace open-match open-match/open-match \
--set open-match-override.enabled=true \ # Install the default override configmap
--set open-match-telemetry.enabled=true \ # Enable telemetry logic in Open Match core
--set global.telemetry.jaeger.enabled # Install jaeger with Open Match core
You can configure where and what telemetry you want to emit from your Open Match
deployment. To instrument Open Match with telemetry supports, modify your 06-open-match-override-configmap.yaml to override the related settings. Please refer to how to customize your Open Match deployment for more details.
Below is an example of the data section in om-configmap-override configmap to enable all of the supported telemetry exporters:
matchmaker_config_override.yaml:
  telemetry:
    zpages:
      enable: 'true'
    jaeger:
      enable: 'true'
    prometheus:
      enable: 'true'
    stackdriver:
      enable: 'true'
Prometheus is the server for capturing and analyzing metrics. You can use it to draft metric queries that can be used to debug a service in the moment or tweak a query that can be used in a Grafana dashboard.
To access Prometheus you’ll need to kubectl port-forward port 9090 from your
Kubernetes cluster.
# Port forward Prometheus to your machine, http://localhost:9090.
kubectl port-forward --namespace open-match service/open-match-prometheus-server 9090:9090
Next visit http://localhost:9090 in your browser.
Let’s try an example query, sum(rate(backend_tickets_assigned[5m]))
This returns the number of tickets assigned by the backend server over a 5-minute sliding window period.
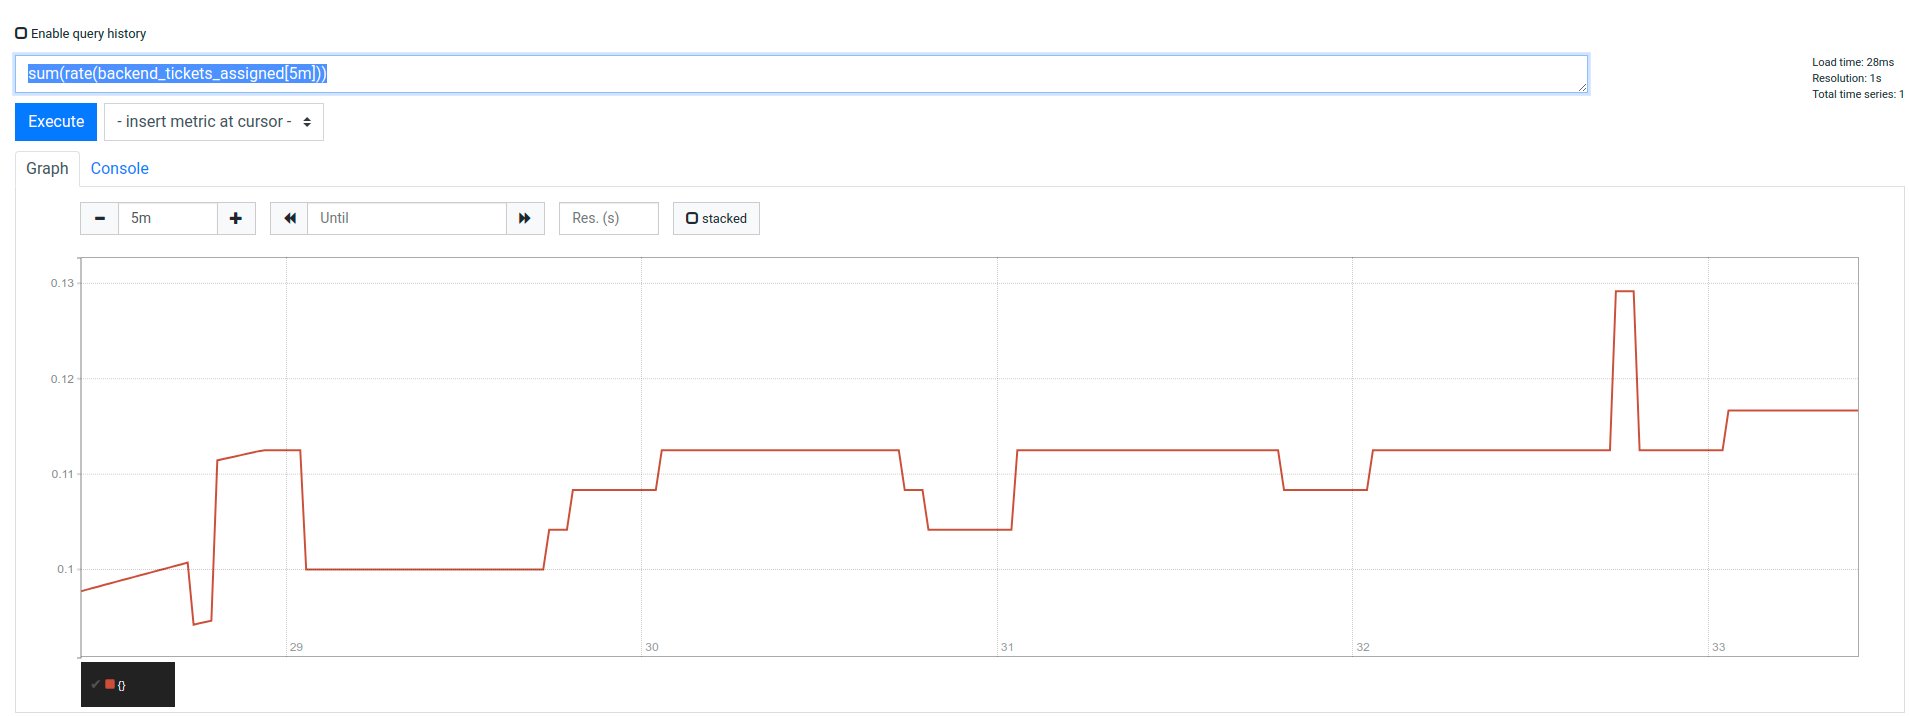
Let’s break down each part of the query.
sum() - This will take the sum over each individual rate produced by
each server (there may be more than 1 backend server).rate(metric_name[5m]) - Take the rate of a particular metric.
Since a rate is not instantaneous we must use a sliding window where we take
metric_name[now] - metric_name[5m ago] at every time point. The
smaller the time window the more exact but choppy the data appears.You can learn how to query your metrics from the Prometheus Query Basics tutorial.
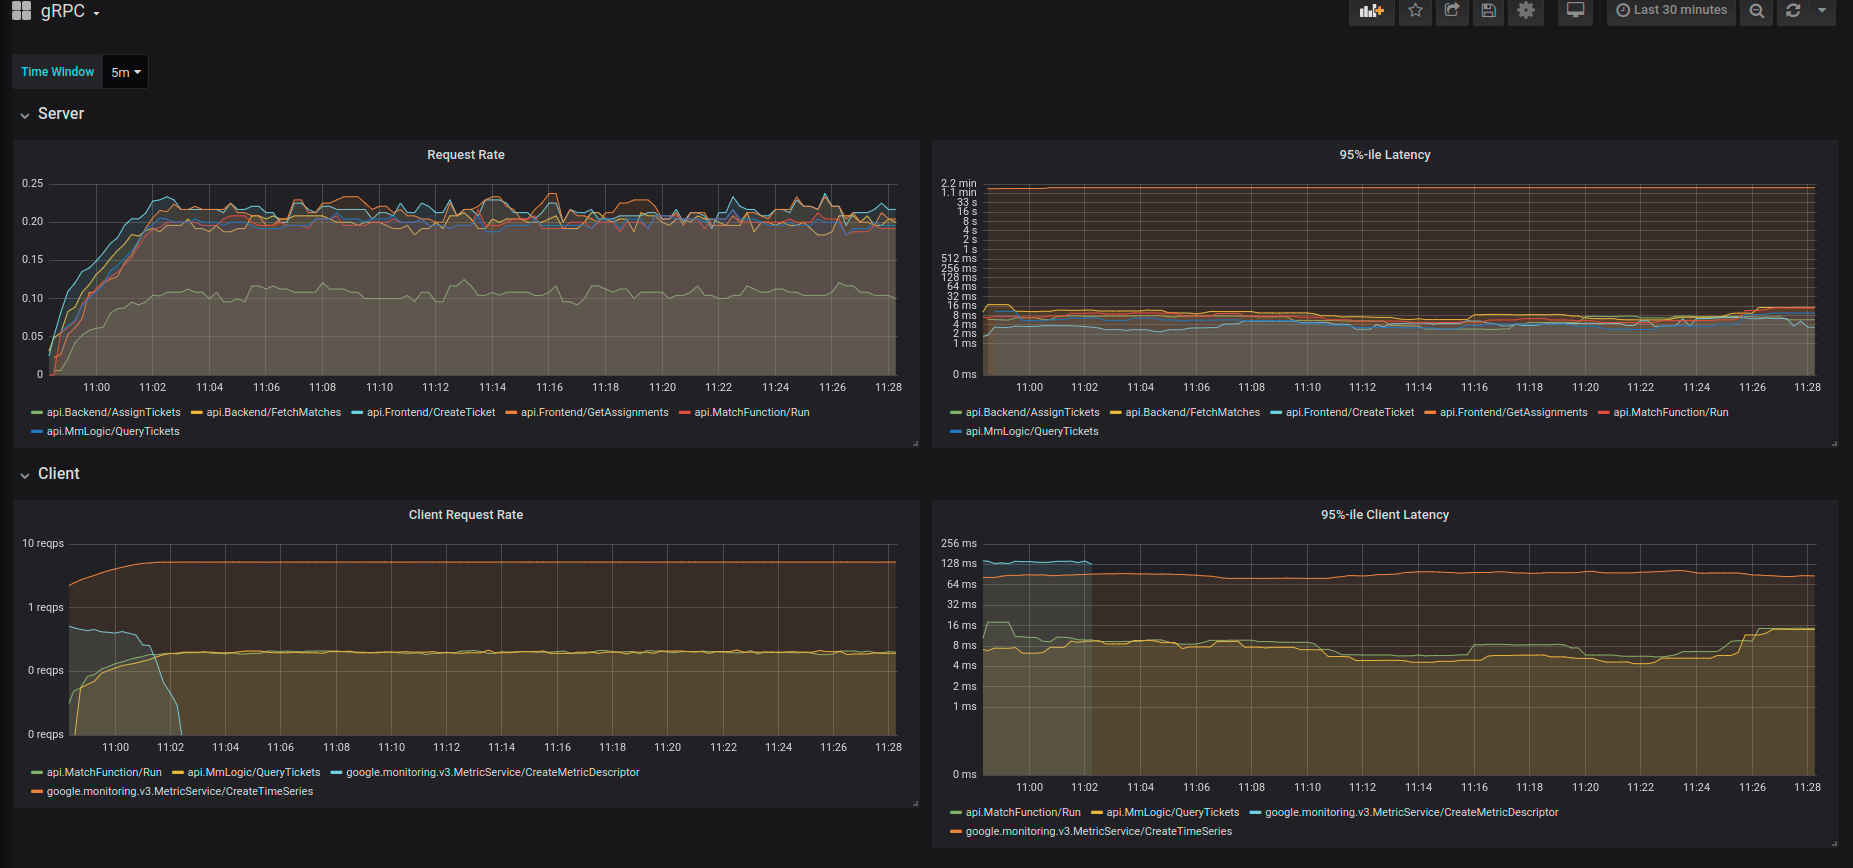
The easiest way to view the health of your Open Match cluster is to browse the Grafana dashboards. Open Match ships with a few dashboards to monitor RPC traffic, database transaction rates, and database transaction time.
To access Grafana you’ll need to kubectl port-forward port 3000 from your
Kubernetes cluster.
# Port forward Grafana to your machine, http://localhost:3000.
kubectl port-forward -n open-match service/open-match-grafana 3000:3000
Next visit http://localhost:3000 in your browser with
Username: admin Password: openmatch.
Once you’re in the Home Dashboard try selecting gRPC. You’ll see a page like this:
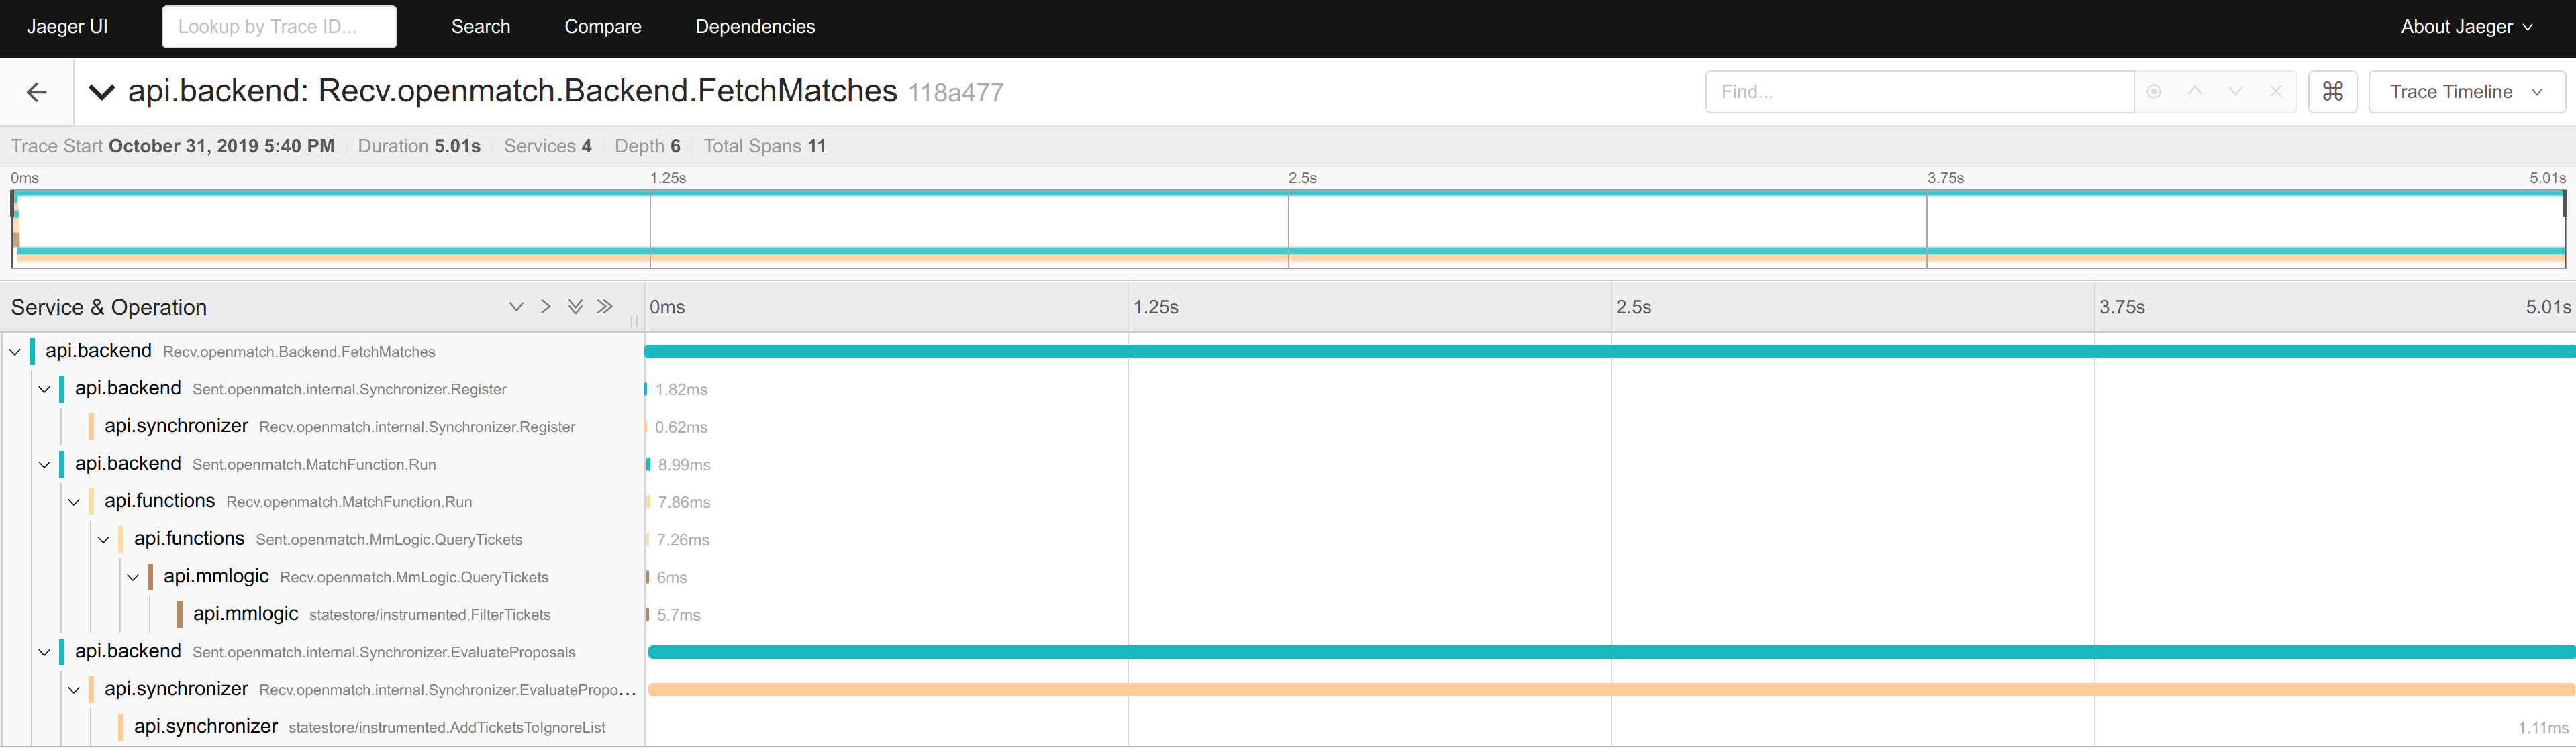
Jaeger is a distributed tracing tool. To view the Jaeger frontend, please run
# Port forward Jaeger frontend UI to your machine, http://localhost:16686.
kubectl port-forward -n open-match service/open-match-jaeger-query 16686:16686
Next visit http://localhost:16686 in your browser. You’ll see a page like this:
What metrics are included in the Go Processes dashboard?
What metrics are included in the gRPC dashboard?
What metrics are included in the Redis dashboard?
Was this page helpful?
Glad to hear it! Please tell us how we can improve.
Sorry to hear that. Please tell us how we can improve.